AI Risk Map
A thought-starter for identifying AI-specific risk factors.
-
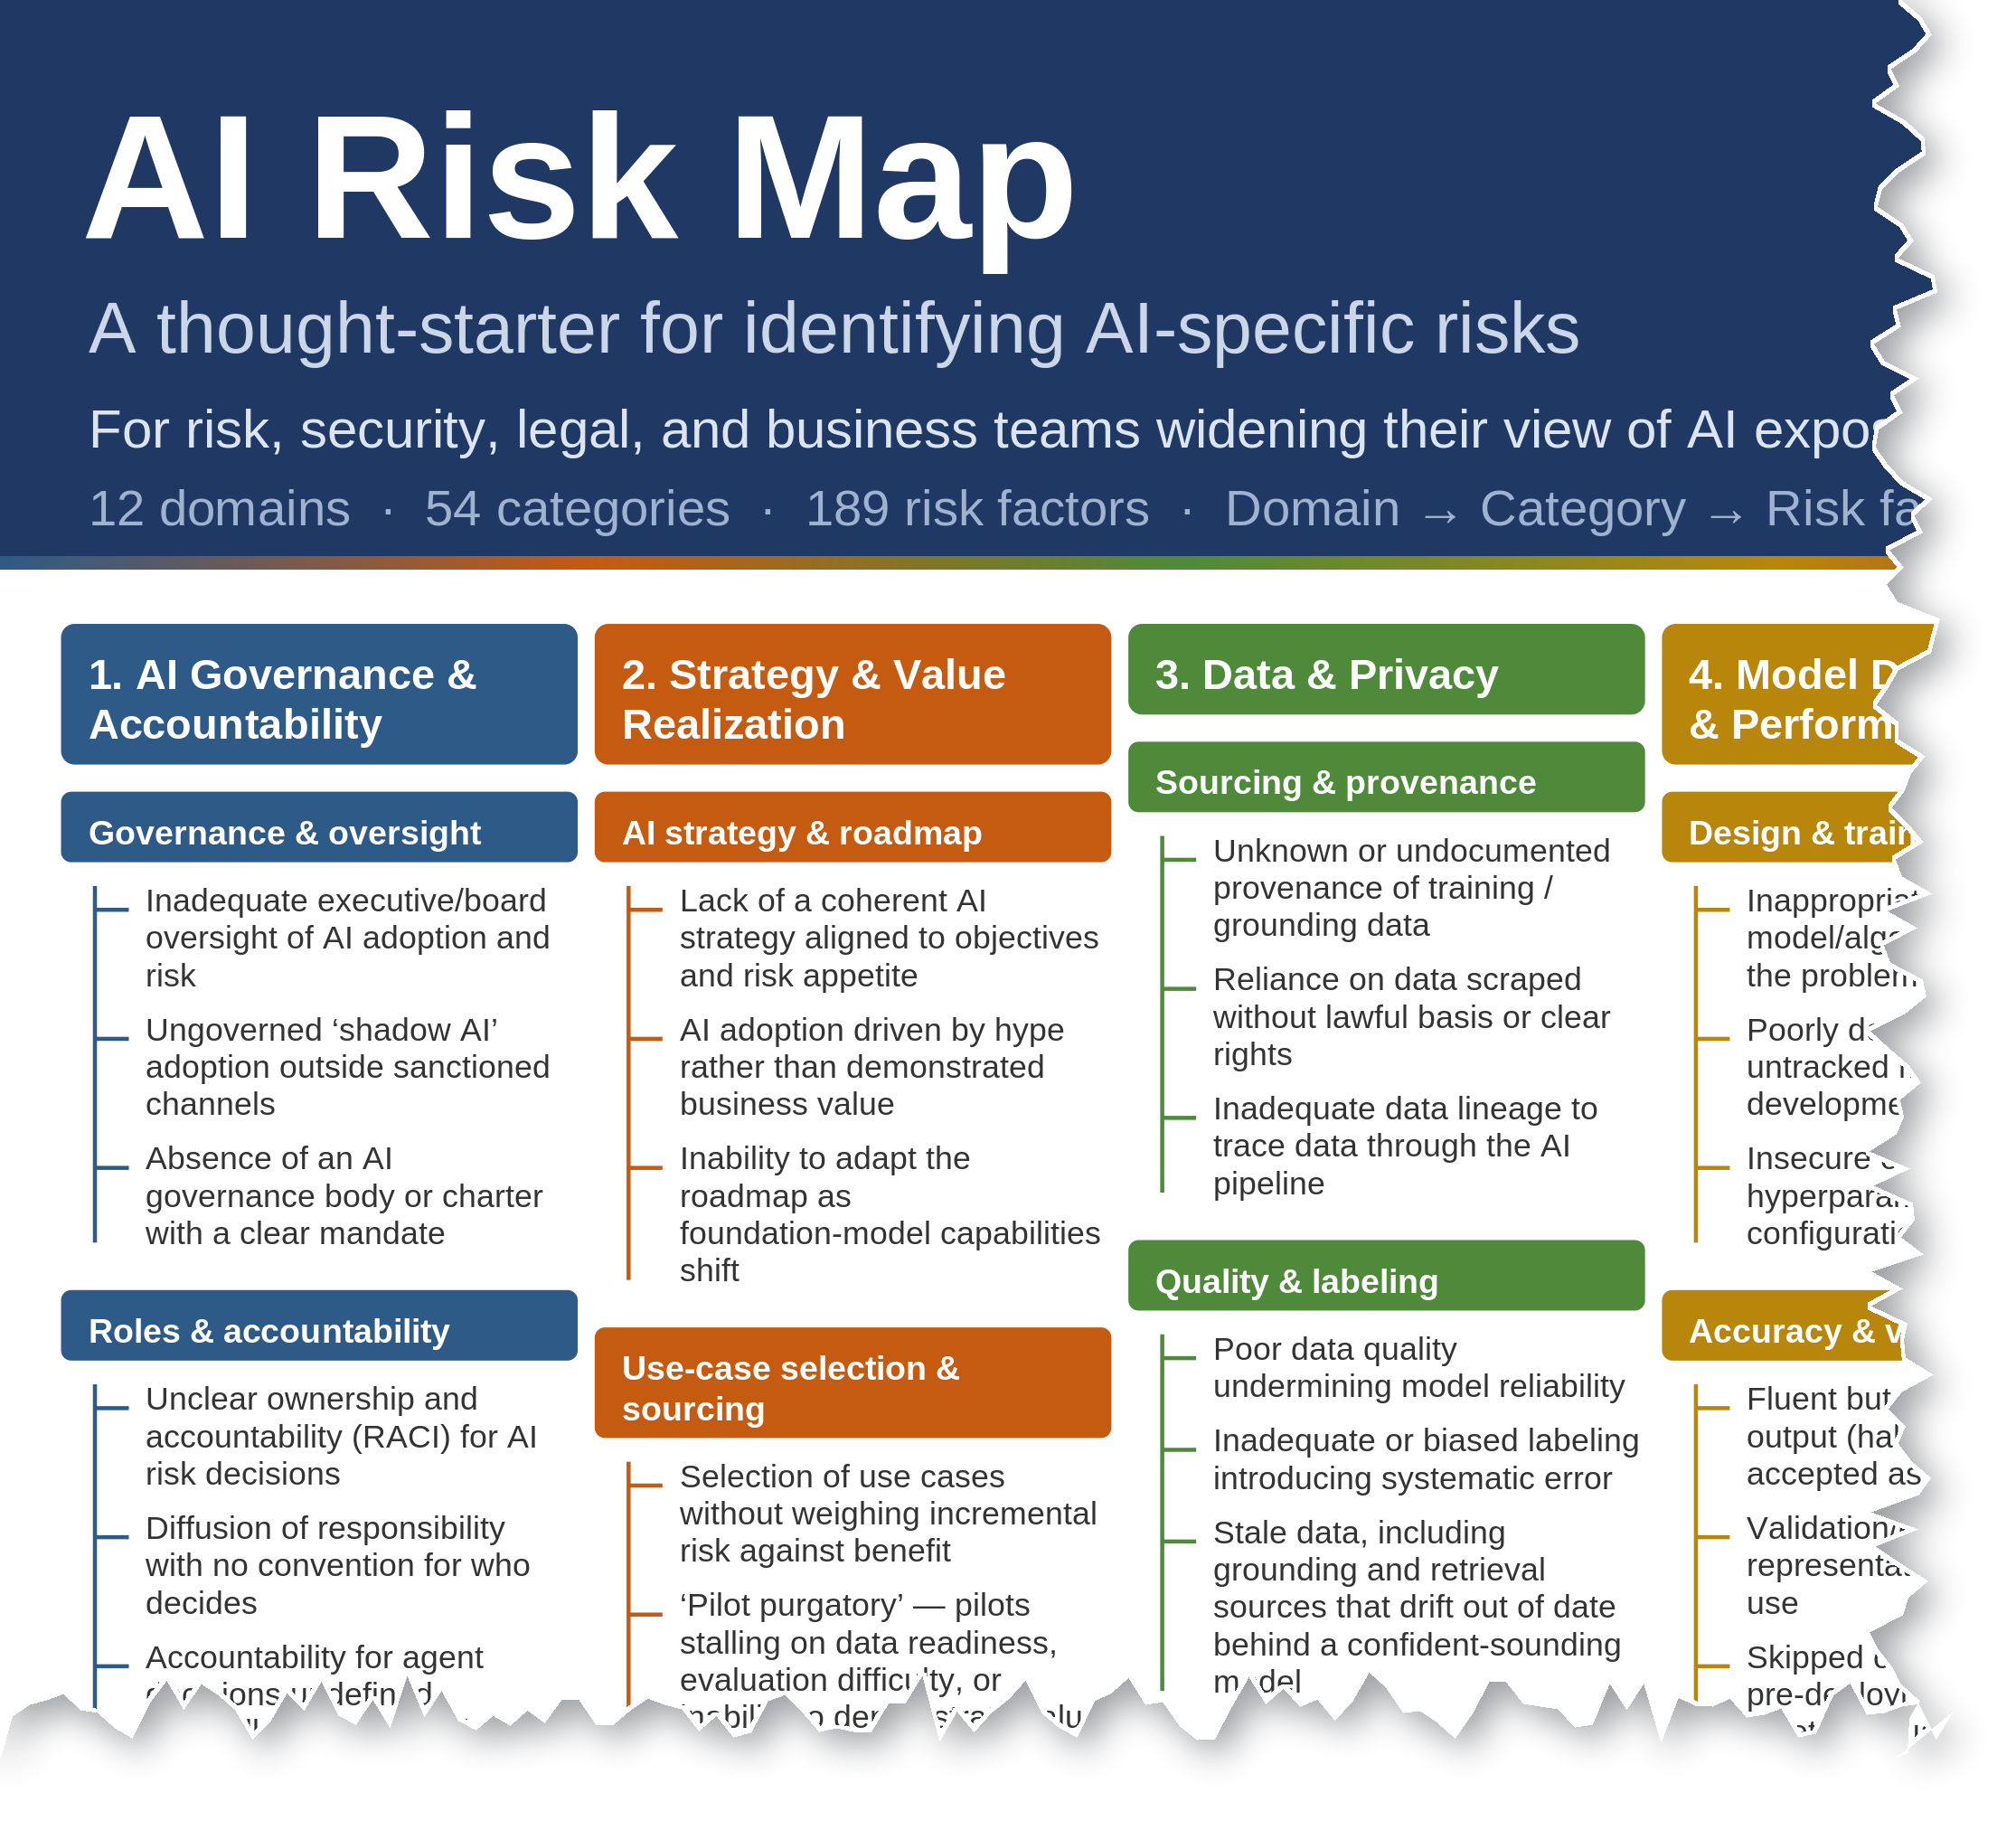
 Structured overviewA single-page view across major domains of AI risk.
-
 Visual hierarchyDomains → categories → risk factors to guide broader thinking.
-
 Blind spots revealedSpotlight overlooked risks most teams miss.
-
 Better conversationsSparks sharper discussions and stronger decisions.
What it is
A single-page visual reference that helps teams widen their perspective, surface blind spots, and find overlooked AI risks.
What it covers
The risks that come with your organization's own use of AI — what you take on when you build, buy, and deploy AI.
189 risk factors across 54 categories and 12 domains, organized by who owns the risk in the enterprise, not by technology: governance, strategy, data, model development, security, safety, operations, legal, third-party, workforce, financial, and autonomous action.
Get it
- PosterPDF · PNG · SVG
- Taxonomy workbookXLSX
- Flat tableCSV
- Corpus for AI assistantsMD
Why I made it
Years ago, when organizations were beginning to adopt public cloud, my boss brought a cloud risk poster into the office. It wasn't an assessment framework or an exhaustive inventory. It was a visual reminder to widen our perspective — and it sparked better risk conversations.
When generative AI became part of our everyday conversations, I found myself wishing I had something similar for AI. The AI Risk Map is my attempt to create it.
How to use it
- In a workshopPut the poster up and ask which factors nobody has discussed. The PDF prints at 48 × 36 in, a standard large-format size at any print shop.
- With an AI assistantLoad the markdown file and ask domain-specific questions.
- In your own toolingMap against the CSV using the stable IDs
AIRM-001toAIRM-189.
What counts as a “risk factor” here
The entries mix conditions, failure modes, threat events, and loss events. They are not well-formed loss-event statements in the FAIR sense — scope one into a proper risk scenario before using it in analysis. Some factors scope cleanly into CRQ/FAIR scenarios; others are board-narrative.
What it is not
- Not a control framework. It names risk factors, never controls.
- Not a threat register. Other people's AI used against you (deepfakes, AI-enabled fraud) is deliberately out of scope.
- Not a scoring tool. Position, order and ID number say nothing about likelihood or severity.
Limitations
- A point-in-time view of a fast-moving field.
- The map helps surface possibilities; it doesn't determine which risks matter most to your organization.
- The twelve domains assume a typical enterprise structure and may not match yours.
- It seeds threat modeling and risk assessment; it complements, it does not replace, system-specific models.

How it was built
The map lists the risks AI introduces, or amplifies in a specific and nameable way. Generic IT, cyber, and vendor risk that exists identically without AI stays off — that one constraint is what keeps the map focused. A candidate earned a place by clearing any one of three gates:
- AI-specific
- Remove AI and the risk vanishes.
- Management delta
- The risk is not new, but the way it must be managed is — and the delta has to be specific.
- Corroboration
- Two or more independent AI standards name it.
Sources span regulation, standards (NIST, ISO/IEC), threat frameworks and academic taxonomies. All 189 factors carry citations verified against primary texts.
A few entries may look like duplicates. They aren't: where the same outcome can be caused by either an attack or an operational condition (data poisoning versus poor data quality), each is its own risk factor with different drivers. The pairs are cross-referenced (»n on the poster).
The taxonomy workbook is the audit trail: every factor's sources, a scope-decisions sheet recording what was excluded and why, and a change log across versions. If you're wondering why something isn't on the map, look there first.